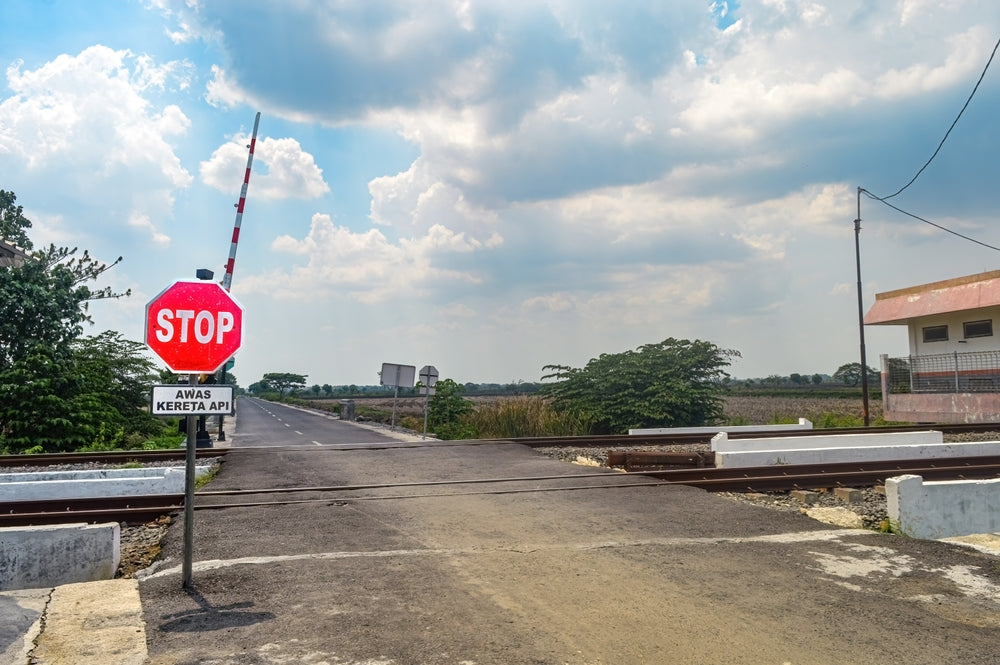
We're working on an interesting project for a gravel pit expansion. The gravel trucks will turn off of a state highway onto a local street to get to the gravel pit. This is a tee intersection with a right turn lane and bypass lane already built on the highway. The intersection has side street stop sign control and low traffic volumes.
The big wrinkle is there's an active rail line paralleling the state highway. There's about 50 feet of storage between the tracks and the highway. The state folks asked if the bypass lane and right turn lane are long enough to store the increased truck traffic or should they be extended.
Modelling the geometry of the intersection/train tracks with Vissim is pretty straightforward. The big wrinkle is getting good existing data to use as the foundation for the modelling. In comes our COUNTcam system.
We set up several cameras and recorded the crossing and intersection for 48 hours on a normal Tuesday/Wednesday. Over the 48 hours, there were 68 trains that caused the gates to go down at the crossing. Each crossing lasted about two minutes. For each train crossing, we noted:
- Time gate went down
- Time gate went up
- Number of cars in bypass lane after train cleared
- Number of cars in right turn lane after train cleared
Then we picked out a couple of time frames that have the most vehicle stacking combined with our added gravel trucks and conducted turning movement counts for those intervals.
This data allowed us to calibrate to the most intense existing conditions and then layer our increased trucking onto that period. Without our video system, collecting this existing data would have been very expensive and there's a chance we would have missed something in the field. With our COUNTcams, we were able to watch the videos several times and get different angles so we could efficiently hone in on the intervals we should model.
